

1. Home
  2. References
  3. MBR surface water, waste site

Reference · Rotreat · Membrane bioreactor (MBR)

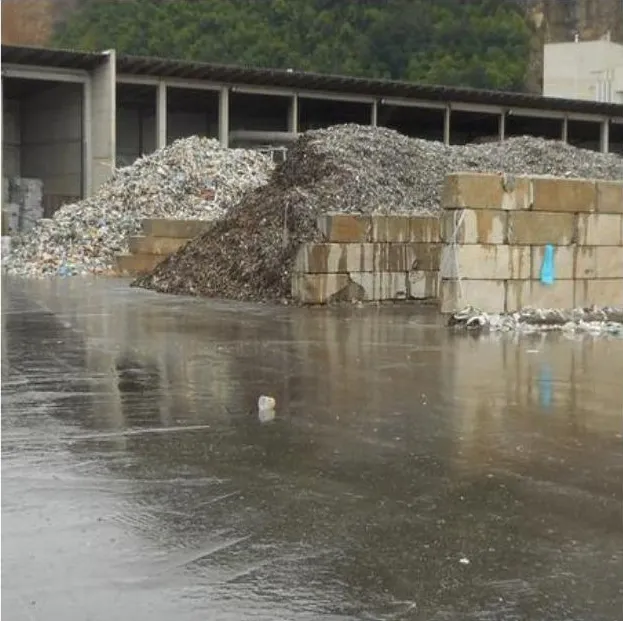
Polluted surface water at a waste management site

Rain run-off from waste heaps and dirty roads may not be discharged into the public sewer. A Rotreat MBR plant has treated this water for direct discharge since it went into operation in July 2019.

Limit values metsince commissioning in July 2019, including at the first measurement after 47 days without feed in winter

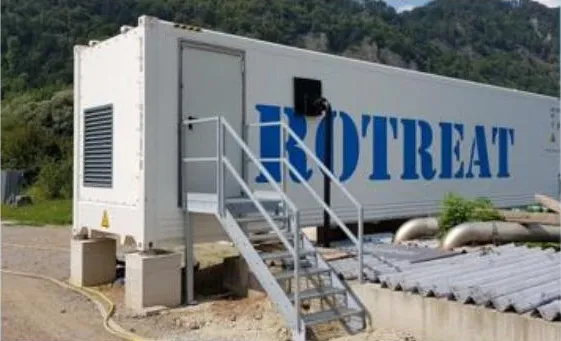
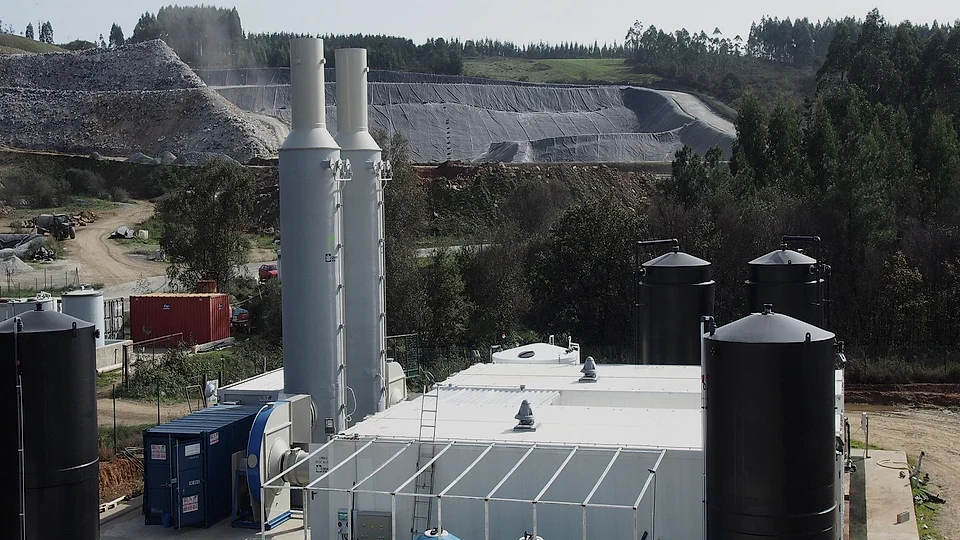
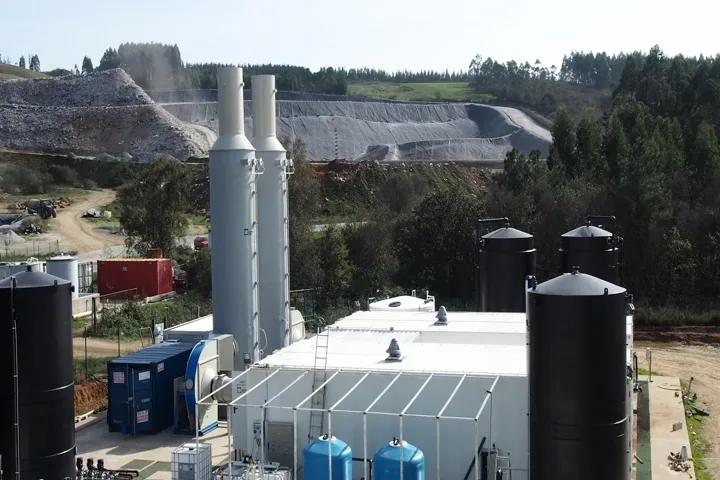
Run-off on a waste management site. Actual installation.

380 m³/daycapacity of the plant
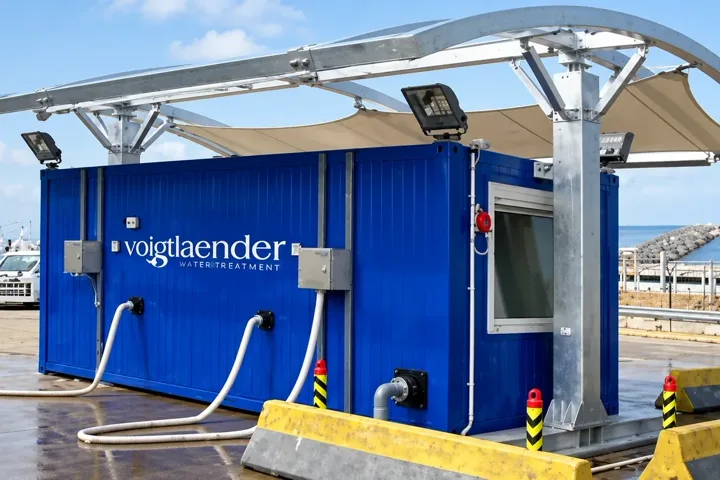
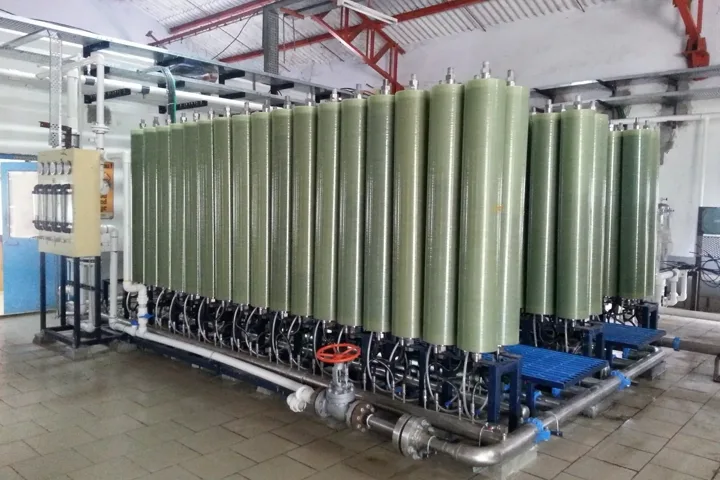
800 m²submerged hollow-fibre membrane in a 40-foot container
July 2019commissioning; limit values met since
47 dayswithout feed in winter; limit values met at the first measurement after restart

The operating data below describe this surface-water MBR installation.

Rain run-off with no way into the sewer

Contact water from outdoor waste heaps and rain run-off from dirty roads collects on the site, contaminated with organic and inorganic substances. Discharging this rain-induced wastewater into the public sewer is not allowed and would be problematic because of the hydraulic peak load, so it had to be treated before direct discharge.

The site covers about 43,000 m², with surface water collected in two areas. The limit values for direct discharge were exceeded: COD averaged 151 mg/l in area A (range 51 to 385) and 466 mg/l in area B (range 143 to 1,590), against a limit value of 120 mg/l. Quantities and qualities fluctuate strongly, heavy rain events alternate with dry periods of up to 8 weeks, and the inflow temperature in winter is below 5 °C.
Storage and membrane bioreactor

The task was to store and treat the first heavy rainfall, with a storage volume for at least 15 minutes, and to reach direct discharge according to the national emission regulation. COD, nitrogen and phosphorus had to be removed.

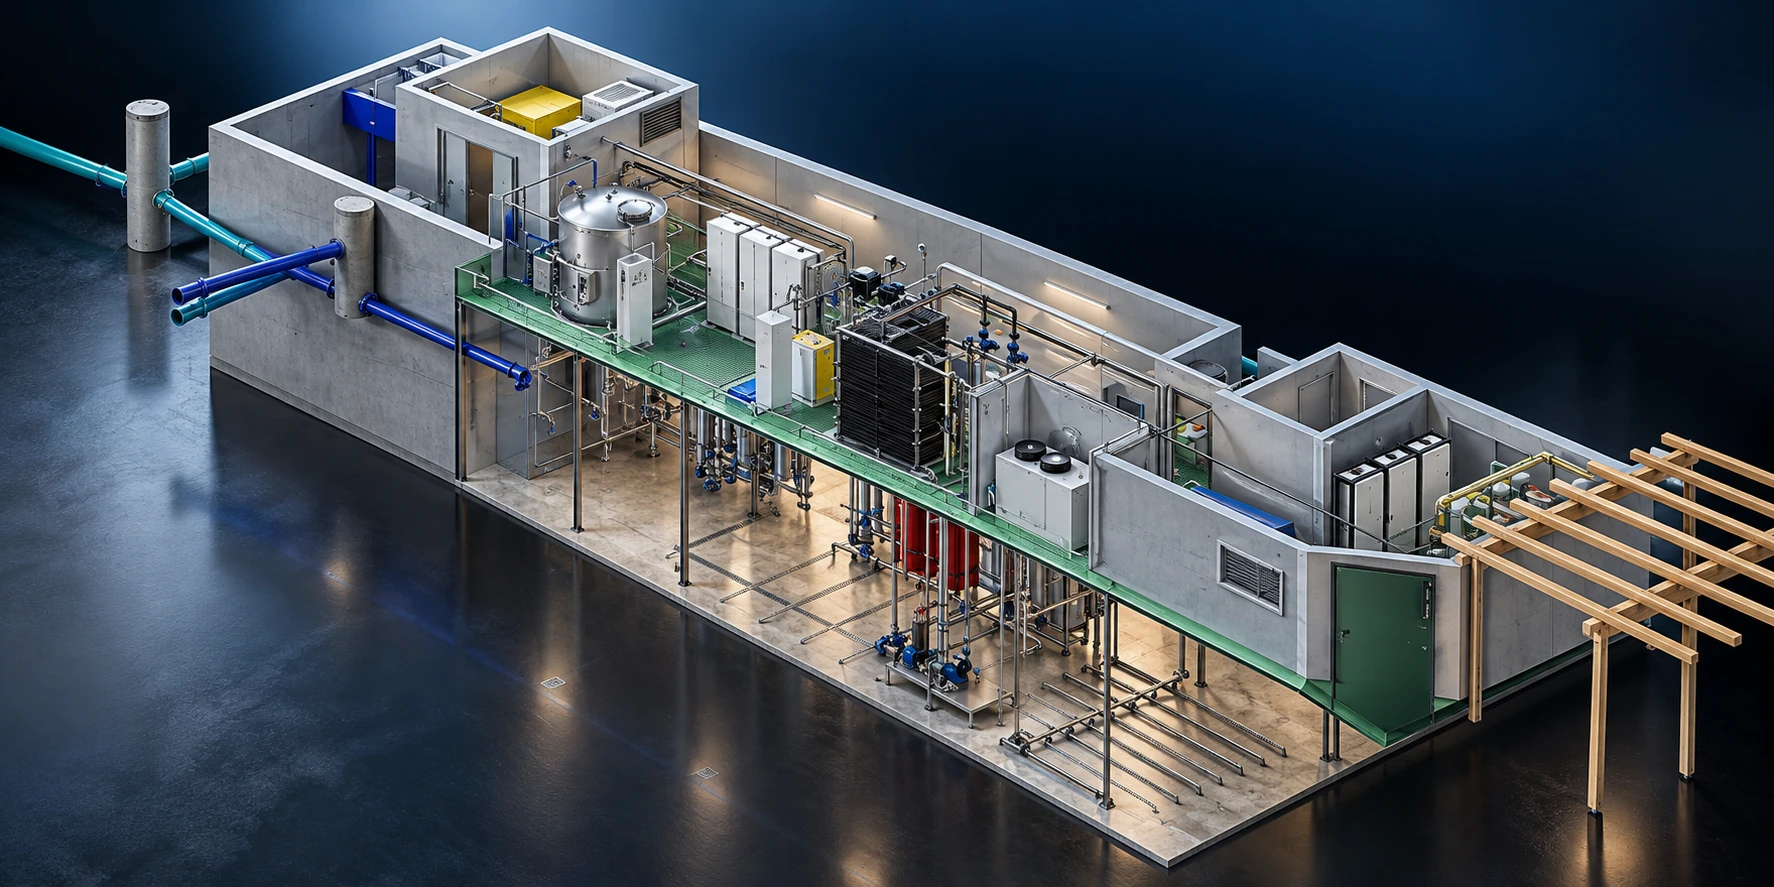
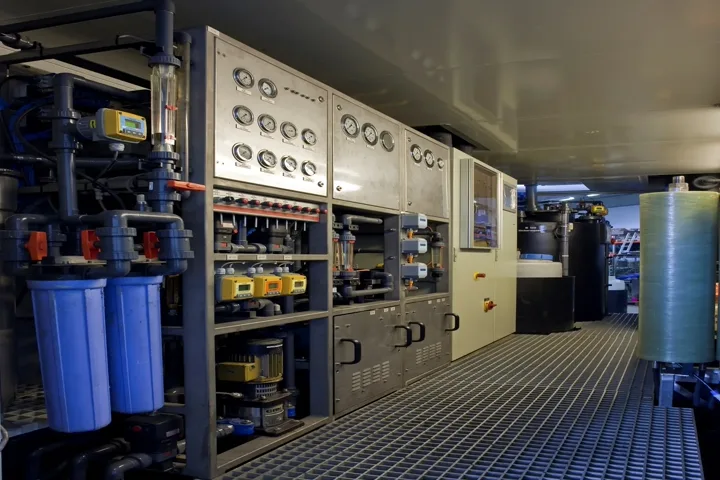
The plant went into operation in July 2019 in a 40-foot operating container: a submerged hollow-fibre membrane module of 800 m² (PVDF, cut-off 50 nm), an MBR volume of 80 m³, aeration of 190 Nm³/h and a water throughput below 16 m³/h. The storage basin is emptied in less than 48 hours; the throughput follows the storage level.

A second site, a higher load

A follow-up project went into operation in August 2020 on a site of 15,000 m²: 170 m³/day, a membrane module of 400 m², an MBR volume of 50 m³, a throughput of 7.3 m³/h and direct discharge. Limit values have been met constantly since the start.

The load was higher: on average 750 mg COD/l (limit value 120 mg/l), 50 mg total nitrogen/l (limit value 12.2 mg/l) and 10 mg total phosphorus/l (limit value 2.0 mg/l). The process includes nitrification, denitrification and phosphorus precipitation.

How the plant works

From run-off to discharge

  1. 1

    Collection

    Surface water from two areas of the site runs into the existing sedimentation basins.

  2. 2

    Storage

    The storage basin takes the first heavy rainfall and is emptied in under 48 hours.

  3. 3

    Membrane bioreactor

    MBR volume of 80 m³ with a submerged hollow-fibre module of 800 m².

  4. 4

    Discharge

    The filtrate is discharged directly, according to the national emission regulation.

  5. +

    Reuse

    The filtrate can be reused as process water.

On site

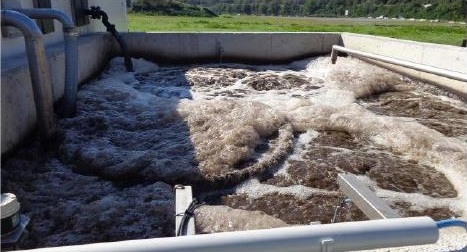
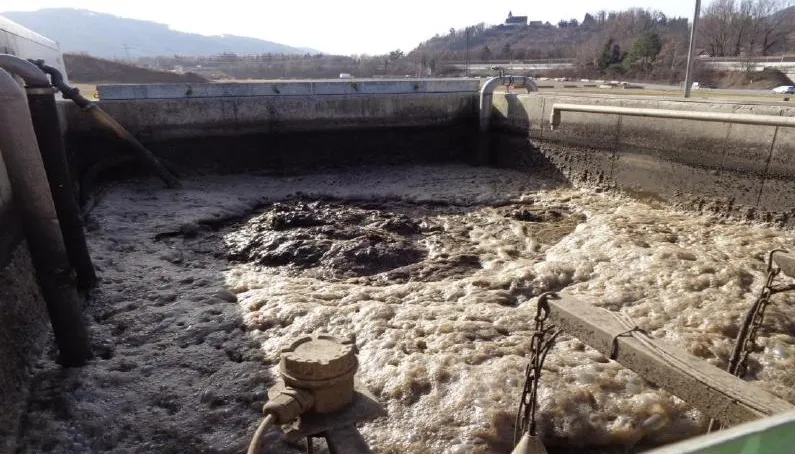
The aerated basin, the bioreactor and the container

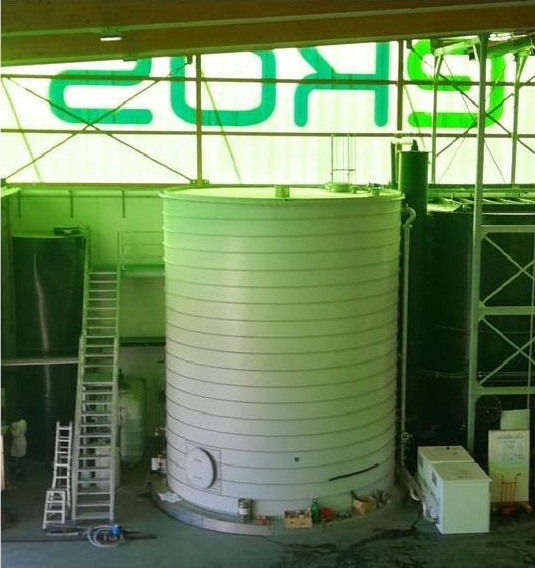
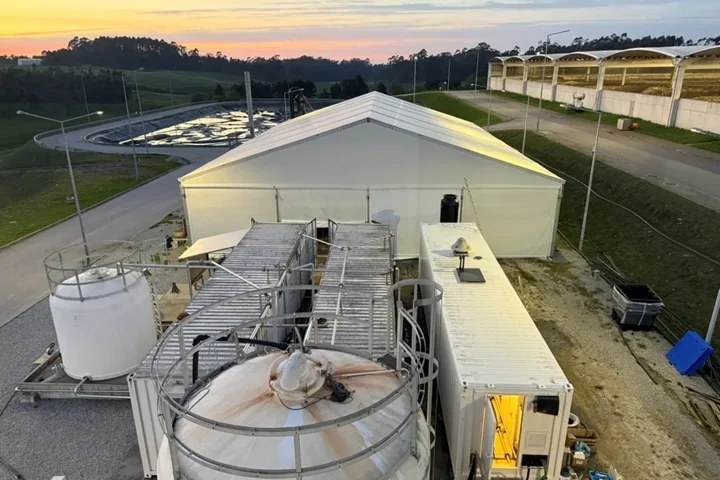
Aerated basin, bioreactor and operating container.

Aerated basin of the MBR plant

Aerated basin. Actual installation.

Bioreactor basin of the MBR plant in operation

Bioreactor basin. Actual installation.

Operating container of the MBR plant

MBR operating container. Actual installation.

Results

What the plant has done since 2019

July 2019limit values met since commissioning
47 dayswithout feed in winter, biology down to 4.5 °C; limit values met at the first measurement after restart
> 300 m³/dayseveral heavy rain events in summer, with no impairment of biology or membrane
0.44 kg TS/kg CODsludge yield

Source: Rotreat MBR project data (surface water, 2019). All values relate to this project and its period.

How to read the results

What the results show and what not

The measured results on this page belong to this installation and its feed water.

What the results show

  • A plant designed for this site's water has met the limit values since commissioning, including a winter standstill and heavy rain.
  • Stable membrane permeability, with regular cleaning necessary.
  • A conservative design (biovolume, membrane area) improved flexibility and durability.

What they do not show

  • Results for another site. Run-off quantities and qualities, limit values and climate differ from site to site.
  • That is why an on-site pilot trial makes sense: it shows the fluctuating quality and quantity and reduces the risk.

From reference to your project

How this works for your site.

This project shows one application. Explore the treatment approach and the decisions that matter before adapting it to your site.

Your site

Start with a pilot trial

For a new site, the design begins with the water analysis and, where quantity and quality fluctuate, with a pilot trial on site.

No obligationPersonal response after review

+49 89 90 17 39 75

Speak to our team directly

Prefer a conversation to a form? We assess your situation professionally and name the next review step.

Get in touch ›

Send in a water analysis

Already have analysis values? Send them to us, and we will review them and come back with a first assessment.

Send an analysis ›